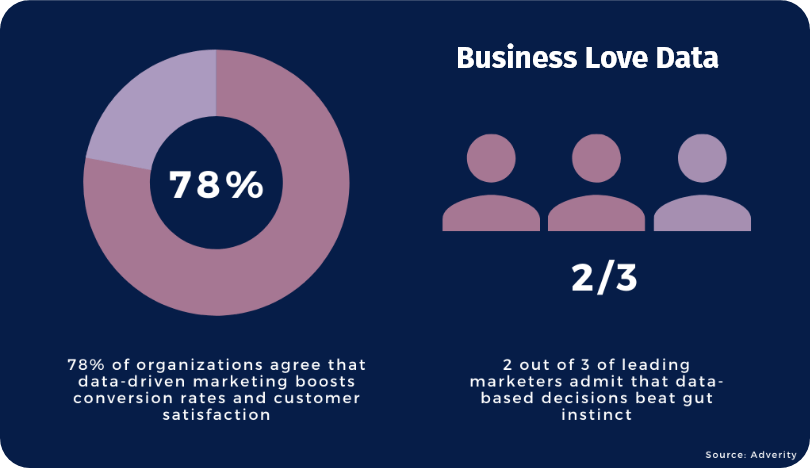
Let the data do the talking. According to the Adverity’s report on smart analytics for higher ROI, most of the businesses agree that data-driven is the way to be:
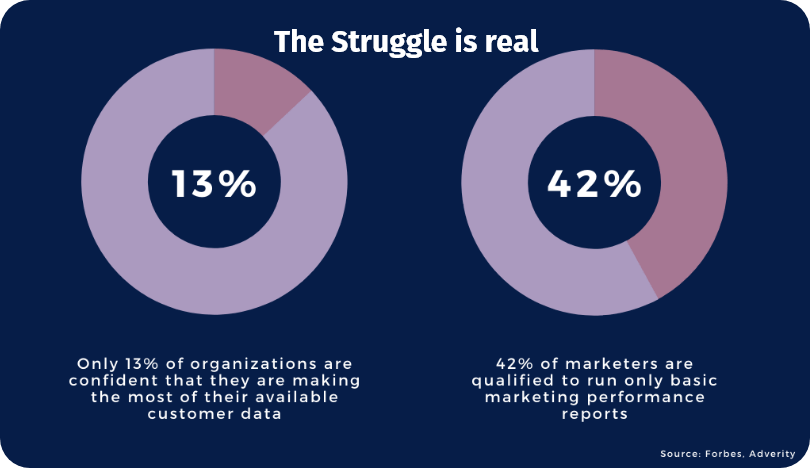
However, the implementation of analytics-based business strategies gets complicated:
It’s clear that marketers and digital managers unanimously agree on the importance of analytics, but many fail to use it in their decision-making process. Why?
Here are 10 concepts and best practices that all digital managers should know in order to befriend numbers and make them reveal valuable insights.
1. 4 in 1: types of analytics
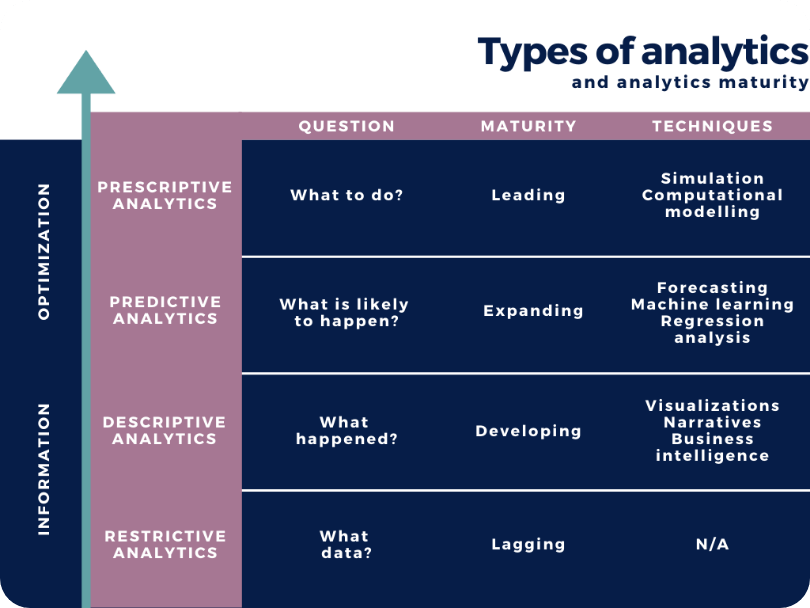
Companies can engage with data on 3 different levels, or find themselves in the fourth one, signalizing the absence of analytical know-how:
Restrictive analytics
The restrictive type is basically a “level 0” in the journey to become data-driven. Characterized by the lack of technology and analytical skills, it manifests itself with a question “What data?”.
Descriptive analytics
On the descriptive level, the data or content is examined manually to answer the question “What happened”?
Predictive analytics
A more advanced type of analytics, where current or historical data is analyzed to make predictions about future events: “What is likely to happen?”.
Prescriptive analytics
Blending the descriptive and predictive analysis, the final prescriptive level determines actionable insights: “What to do?”.
Understanding the types of analytics is a must because the abundance of data brings the abundance of possibilities. How many of them are within your reach today? Approaching the data with a clear structure in mind helps figure out what information and tools are the best to answer specific questions.
2. Analytics maturity
The buzzword “analytics maturity” describes the organization’s ability to effectively practice data collection, exploration, and informed decision-making.
The data mastery is a step-by-step process and reaches its peak as simple insights transform into active process optimization. Each stage of maturity corresponds with the type of analytics involved and can be characterized as lagging, developing, expanding, or leading.
Why is it important to understand and reflect on the analytics maturity? As it gets higher, it pushes for better decisions, more substantial business impact, and greater return on investment on your analytic systems. A honest self-evaluation focused on the depth of analysis your business is capable of performing is a condition for growth and improvement in the data-driven world.
3. KPIs
Even at the early stages of analytical literacy, one must read the data with specific goals in mind. In business, these goals are reflected by KPIs (key performance indicators) – measurable values tracked to evaluate the progress towards them.
As a digital manager, you primarily focus on low-level KPIs, covering the performance of one department, for example, marketing. You strive to:
a) Increase the organic traffic by 30% by the end of the year, or
b) Double the conversion rate from paid social media campaigns in the third quarter.
However, these success indicators might not bring any benefit if not adjusted to the overall organization’s objectives. How do they correlate with the financial and sales goals?
Interconnectedness is an often overlooked aspect of KPIs. To lay grounds for a fruitful data analysis, they cannot be isolated from each other. Odds are that without properly aligned KPIs your company is reporting based on misleading information.
4. Standardized metrics
The metrics “translate” each key performance indicator into a collection of numerical values, so we can finally get our hands on data analysis. For example, if this quarter your KPI is to shrink the customer acquisition cost by 5%, the key metrics to look at should be the total marketing investment and the number of customers acquired. Establishing them both as a standard formula for quarterly customer acquisition cost calculations would mean standardization.
The biggest benefits of standardized metrics are consistency and comparability – the data is regularly analyzed in the same context, and is open for examination in contrast to previous results.
5. Scrubbing
To ensure accurate results, most of the data requires some scrubbing (in other words, cleaning) prior to analysis. This process may involve removing bad or test data, or standardizing the value expressions. For example, it’s common to see “United States of America”, “US”, “USA”, etc. in one list. A scrubbed dataset would be consistent and include only one of the titles.
6. Confirmation bias
One more argument for adopting standardized metrics and carefully structured approach to all data-related operations is confirmation bias. As human beings, we tend to analyse and interpret information in a way that upholds our values or beliefs.
Therefore, confirmation biases are not really a concept to master (as we all do, unintentionally), but rather to remember each time when drawing conclusions out of statistics. Strategic data-driven decisions should be made with rigor and self-awareness.
7. Benchmarking
From setting up KPIs to reading the empirical values – benchmarks come in handy at all stages of data-driven decision making. Benchmarking is a comparative process, measuring the performance of a certain aspect against the “best in class” or “general norm”. For example, it could be the median email open rate within the beauty and personal care industry.
Looking at the “external” (industry, competitor) benchmarks can widen the interpretational context and even result in prescriptive insights. Meanwhile, establishing them internally helps to drill down into the performance peaks and gaps as well as create a culture for continuous improvement.
8. Median
A tip for quality benchmarks: opt for the mean over the average. The average is probably the most common benchmark value, but not the most representative one. Why?
It’s because the average calculation includes the most extreme values in a dataset, giving equal weight to both smallest and largest values.
Being just a data point in the middle, median does not. Extremities do not affect this metric, so it can provide a more accurate representation than the average.
9. Data visualization
Data visualization is a step you don’t want to miss. As humans can grasp information through visuals more effectively than using other mediums, the raw data transformed into simple graphic representations is on demand.
Generally, visuals enable better and faster analysis, increased ability to spot patterns, mistakes, and trends. It helps to understand the story behind the empirical facts and even allows to perform some basic modelling actions (what if?).
You can do data visualization manually, but businesses that aspire to excel their analytical capabilities often opt for tools that can handle large levels of information and convert them into meaningful visual experiences.
10. Data sharing
Data sharing can break corporate silos. Making information available increases its value: teams that have data within reach make informed decisions that accurately reflect information from inside and outside the organisation.
Take the time to institute a standardized data sharing procedure across your team and other departments. Consider the types of data you are collecting, who might need to work with it, how to minimize risks and manage permission and restriction systems. A common data management platform is a popular solution to create a better sharing culture within the organization.
Understanding your data starts from the approach to it: before going all-in, you might want to dig deeper into the types of analytics, the concept of analytics maturity, and setting up smart KPIs.
Then, it comes down to the technique: mastering data scrubbing and standardization, creating benchmarks and selecting the most representative values, all by keeping confirmation bias in mind.
The informed decision making process begins with reading and managing the information. You have to treat the data right: put it to life by turning numbers into visuals and store the information in a securely accessible way.